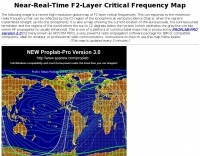
Near-Real-Time F2-Layer Critical Frequency Map
This map can be used to determine the frequencies that will always be returned to the Earth. Transmitted frequencies higher than the indicated contours (which are given in MHz) may penetrate the ionosphere, resulting in lost power to space.
The map shows the radio auroral zones as green bands near the northern and southern poles.
Hits: 5271 | Votes: 24 | Rating: 4.84
Resource Details
You will find this resource in just one category on our links directory. The title of the main category is MUF Indicators and it deals mainly with MUF Indicators. The resource has been on our site since Sunday Sep 3 2006, and it has been viewed 5271 times. So far it received 24 votes for a total score of 4.84/10Rate this resource
it received 24 votes for a total score of 4.84/10
The scale is 1 - 10, with 1 being poor and 10 being excellent.
Webmaster, add a Remote rating
Link not working?
Occasionally, links may expire, move, or become outdated. If you've encountered a problem, kindly Report it here. We'll promptly look into the issue and update the link if possible. We appreciate your feedback!More Like This
If this particular resource doesn't quite meet your needs, don't worry! In the same category, you'll find several other links that may be equally interesting and relevant to what you're looking for. We encourage you to explore these additional options, as they might offer the insights or information you're seeking.- Current Optimal Frequency Charts - Optimal Working Frequencies (MHz) for High Frequency (HF) / Shortwave ...
- Real-time OWF, MUF & maximum NVIS frequency for your QTH - Real-time dashboard with 3000km optimal working & maximum usable frequ...
- HF Radio Propagation Forecast - This page offers radio amateurs (experienced and beginners) a useful o...
- HamDXMap - This dynamic DX Map aggregates various resources that will help radio ...
- KC2G HF MUF Propagation maps - Ionospheric propagation maps MUF and critical frequency...