Zplots - Impedance Plots with MS Excel Charts
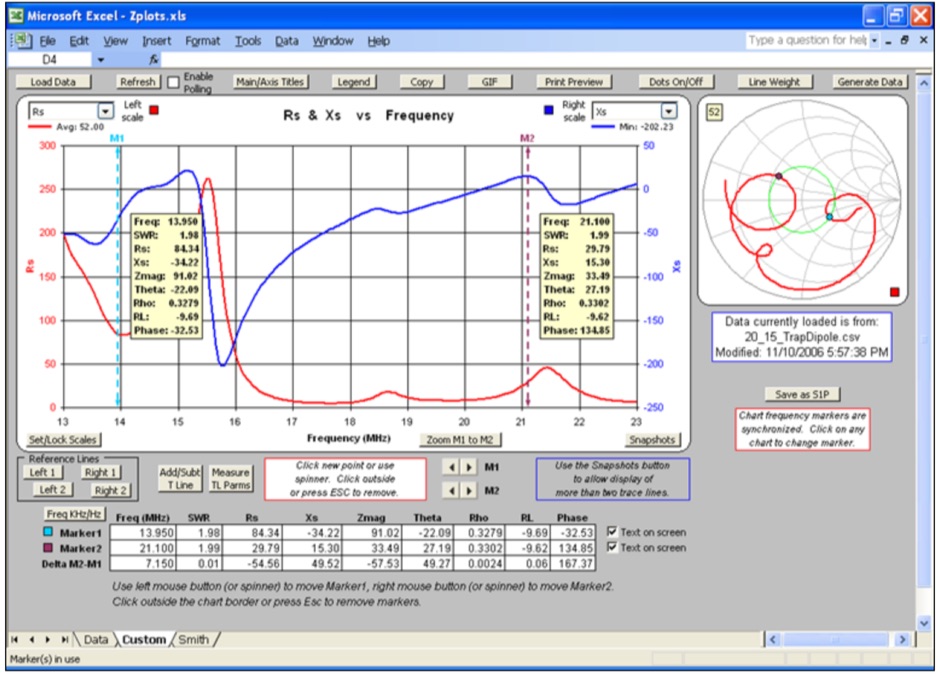
By AC6LAZplots is an Excel application that allows you to plot impedance and related data obtained from a variety of sources. You can plot on both an XY chart and a Smith chart as well as view the data in tabular format.
The XY chart can be customized with your choice of trace lines. Frequency (in MHz) is always shown on the X axis.
Hits: 303 | Votes: 0 | Rating: 0.00
Resource Details
You will find this resource in just one category on our links directory. The title of the main category is Antenna analysis and it deals mainly with software,antenna analysis software, for ham radio operators and hams. The resource has been on our site since Wednesday May 30 2018, and it has been viewed 303 times. So far no one has rated it yet. Be the first to rate it!Last updated: 2018-05-30
Rate this resource
no one has rated it yet. Be the first to rate it!
The scale is 1 - 10, with 1 being poor and 10 being excellent.
Webmaster, add a Remote rating
